After ten years in FP&A, I've learned the value isn't in producing the reports, it's in the time they free up to partner with the CFO and the business managers. This project shows how I use data analysis, automation and AI agents to run a monthly close cleanly and safely, so an analyst spends less time assembling numbers and more time acting on them.
EventCo is a fictional events agency I created a full dataset for. It mirrors the numbers a real finance team works with every month: the full P&L plus the operational drivers behind it, headcount and projects delivered, for four business lines over thirty months.
Every problem below is one I have met in a real close: mixed date formats, typos in names, amounts typed as text, a duplicate row, and one revenue figure with an extra digit (EUR52m in a EUR5m month).
| month | business_line | revenue_budget | revenue_actual |
|---|---|---|---|
| 2024/08 | Brand Events | 2302070.569481089 | 2309849.1588302534 |
| 2024-12-01 | Brand Evnets | 4276001.483833633 | 4309897.281548161 |
| October 2025 | Brand Events | EUR4,819,709 | 4785780.885165885 |
| November 2025 | Brand Events | 5238445.244445545 | 52243583.97067126 |
| April 2026 | Digital/Inlfuence | 2616866.7941705612 | 2687265.017168981 |
| April 2026 | Digital/Inlfuence | 2616866.7941705612 | 2687265.017168981 |
All synthetic and generated from a fixed seed. No real employer data, no client names.
Accounting export, business notes, HR and operations. Unclean, from several systems.
Fixes dates, names, duplicates and text amounts. Flags anything that looks like an entry error.
Variance vs budget, rolling forecast, and a check that no raw data leaves the company.
Explains the gaps the data can't, runs manual controls, edits the commentary and signs off.
Variance analysis, forecast, executive summary, and a one-pager for each business line.
The system flags 20 material variances. It explains only the 4 backed by a documented note. The other 16 come to me: I explain 14 after following up with the business, and 2 stay openly unexplained. Every line in the pack shows which of the three it is.
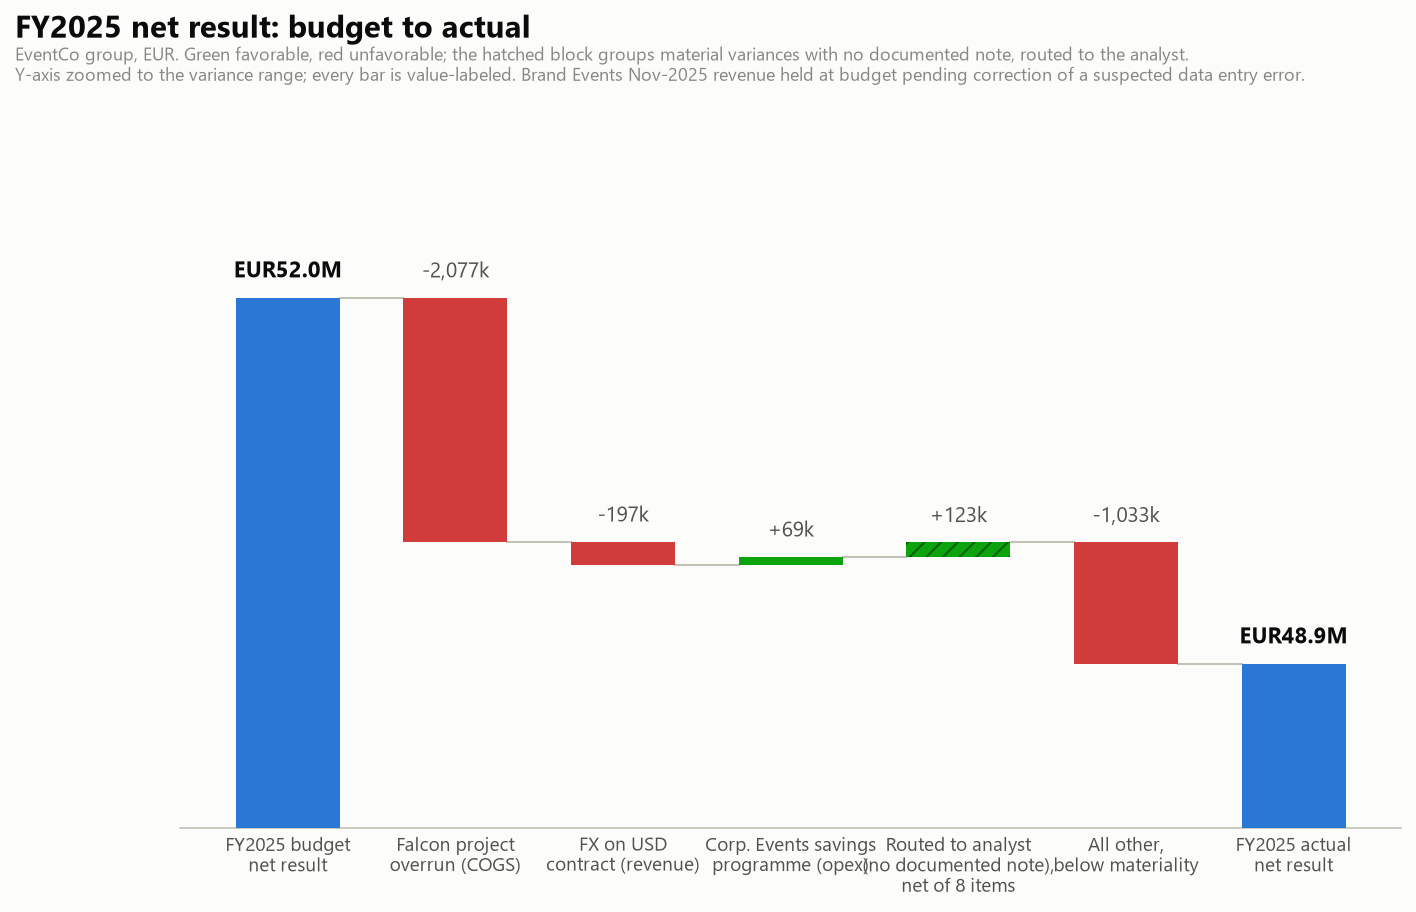
"Three stories dominate the variances: a EUR2.08 million cost overrun on a client project, a currency swing on an international contract, and a cost-savings programme that ran ahead of plan."
The opening of the executive summary, and the full-year walk from budget to actual behind it, reconciled to the euro.
The story of the close, for the CFO.
Read it →All 20 variances, each with its source.
Read it →Next quarter by business line.
Read it →Everything assembled, ending on sign-off.
Read it →Every fix applied to the raw file.
Read it →The checks that run before I sign.
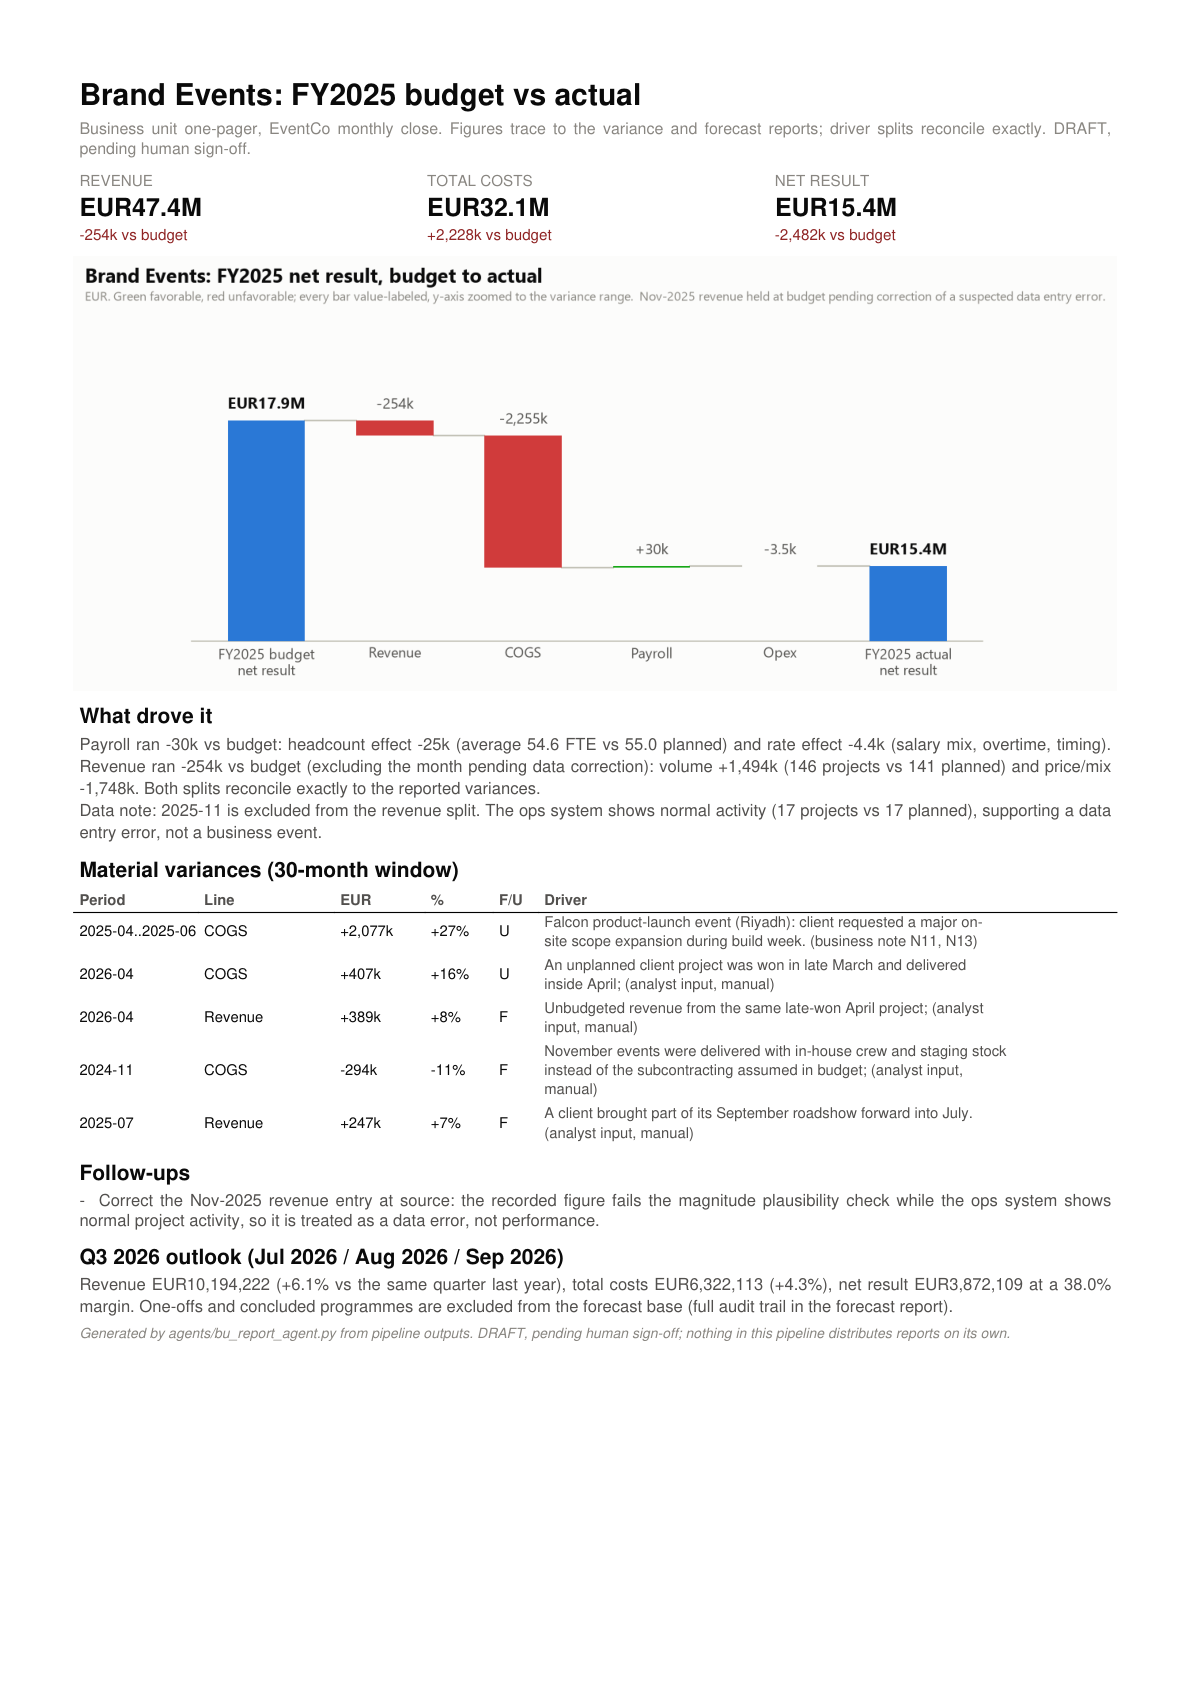
Read it →One page per business line, generated automatically, ready to hand to each manager: budget-to-actual bridge, what drove payroll and revenue, and the open follow-ups.
The point isn't to replace the analyst. It's to hand the analyst back their time, with the data cleaner and the controls already run.
The mechanical work runs in minutes, identically every month. The time goes into the two open questions, not into reformatting dates.
Every cause in the pack is either documented, signed by the analyst, or marked openly unexplained. In a board meeting, that difference matters.
The AI only rewords analysis that is already computed and checked. Every figure is traced back to a source, and an untraceable one fails the run.
Only one step talks to an AI service, and only with aggregated summaries. The raw ledger never leaves the machine, and a check confirms it every run.
A concrete example: one line in the export read 52,243,584 in a business line whose normal month is EUR5 million, with costs and payroll unchanged. A rushed close turns that into a growth story. Here it was flagged as a probable typo, kept out of every number and every sentence, and sent to me for correction. The operations data agreed: a normal month, 17 projects delivered against 17 planned.
$ python orchestrator.py --- Data Ingestion --- Raw rows: 124 -> cleaned rows: 120 BU typos corrected: 7 Duplicates removed: 4 Flagged as likely data errors: 1 --- Variance & Root-Cause --- Material items: 20 corroborated by business notes: 4 explained by analyst input (labeled): 14 still open, no clear driver: 2 --- Rolling Forecast --- Horizon: 2026-07, 2026-08, 2026-09 --- BU One-Pagers --- Wrote 4 one-pagers (.md + .pdf) --- QA / Reviewer --- QA checks: 8 passed, 0 failed PIPELINE COMPLETE. DRAFT ONLY. Nothing sent anywhere. Awaiting sign-off.
Every run is identical and reproducible. The output above is real, and every report it names is one click up the page.
EventCo is fictional, but its monthly close is not. I ran this cycle for real at a EUR100M events agency, including stepping in to close the books when the finance director was out. The overruns, the currency hits and the fat-fingered digits in this dataset are the ones that actually happen. I built this to show what the close looks like when software does the repetitive part and a human keeps the final word.
If you'd like to see what this could look like on your numbers, or your clients', I'm happy to walk you through it.